 Catalogue PIGMA
WP1 Atlantic Ocean IEA
Type of resources
Available actions
Topics
Keywords
Contact for the resource
Provided by
Years
Formats
Representation types
Scale
-

The vision of the AtlantOS project was to improve and innovate Atlantic observing by using the Framework of Ocean Observing to obtain an international, more sustainable, more efficient, more integrated, and fit-for-purpose system contributing to the Trans-Atlantic Research Alliance, the GEO (Group on Earth Observations) global initiative Blue Planet, and GOOS (Global Ocean Observing Systems). Hence, the AtlantOS project will have a long-lasting and sustainable contribution to the societal, economic and scientific benefit arising from this integrated approach. This will be achieved by improving the value for money, extent, completeness, quality and ease of access to Atlantic Ocean data required by industries, product supplying agencies, scientists and citizens. The overarching target of the AtlantOS initiative was to deliver an advanced framework for the development of an integrated Atlantic Ocean Observing System that goes beyond the state-of–the-art, and leaves a legacy of sustainability after the life of the project (see AtlantOS High-Level Strategy and find out more about the AtlantOS program). The legacy derived from the AtlantOS aims: - to improve international collaboration in the design, implementation and benefit sharing of ocean observing, - to promote engagement and innovation in all aspects of ocean observing, - to facilitate free and open access to ocean data and information, - to enable and disseminate methods of achieving quality and authority of ocean information, - to strengthen the Global Ocean Observing System (GOOS) and to sustain observing systems that are critical for the Copernicus Marine Environment Monitoring Service and its applications and - to contribute to the aims of the Galway Statement on Atlantic Ocean Cooperation The project was organized along work packages on: i) observing system requirements and design studies, ii) enhancement of ship-based and autonomous observing networks, iii) interfaces with coastal ocean observing systems, iv) integration of regional observing systems, v) cross-cutting issues and emerging networks, vi) data flow and data integration, vii) societal benefits from observing /information systems, viii) system evaluation and resource sustainability. Engagement with wider stakeholders including end-users of Atlantic Ocean observation products and services was also key throughout the project. The AtlantOS initiative contributed to achieving the aims of the Galway Statement on Atlantic Ocean Cooperation that was signed in 2013 by the EU, Canada and the US, launching a Transatlantic Ocean Research Alliance to enhance collaboration to better understand the Atlantic Ocean and sustainably manage and use its resources.
-
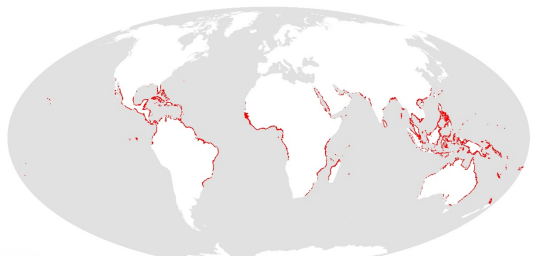
This dataset shows the global distribution of mangroves, and was produced as joint initiatives of the International Tropical Timber Organization (ITTO), International Society for Mangrove Ecosystems (ISME), Food and Agriculture Organization of the United Nations (FAO), UN Environment World Conservation Monitoring Centre (UNEP-WCMC), United Nations Educational, Scientific and Cultural Organization’s Man and the Biosphere Programme (UNESCO-MAB), United Nations University Institute for Water, Environment and Health (UNU-INWEH) and The Nature Conservancy (TNC). Major funding was provided by ITTO through a Japanese Government project grant; the project was implemented by ISME.
-
The Ocean Colour Climate Change Initiative project aims to: Develop and validate algorithms to meet the Ocean Colour GCOS ECV requirements for consistent, stable, error-characterized global satellite data products from multi-sensor data archives. Produce and validate, within an R&D context, the most complete and consistent possible time series of multi-sensor global satellite data products for climate research and modelling. Optimize the impact of MERIS data on climate data records. Generate complete specifications for an operational production system. Strengthen inter-disciplinary cooperation between international Earth observation, climate research and modelling communities, in pursuit of scientific excellence. The ESA OC CCI project is following a data reprocessing paradigm of regular re-processings utilising on-going research and developments in atmospheric correction, in-water algorithms, data merging techniques and bias correction. This requires flexibility and rapid turn-around of processing of extensive ocean colour datasets from a number of ESA and NASA missions to both trial new algorithms and methods and undertake the complete data set production. Read more about the Ocean Colour project on ESA's project website. https://climate.esa.int/en/projects/ocean-colour/.
-

This dataset shows the global distribution of seagrasses, and is composed of two subsets of point and polygon occurrence data. The data were compiled by UN Environment World Conservation Monitoring Centre in collaboration with many collaborators (e.g. Frederick Short of the University of New Hampshire), organisations (e.g. OSPAR), and projects (e.g. the European project Mediterranean Sensitive Habitats “Mediseh”), across the globe (full list available in accompanying metadata table within the dataset).
-
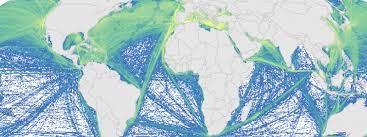
This is a portion of the data used to calculate 2008 and 2013 cumulative human impacts in: Halpern et al. 2015. Spatial and temporal changes in cumulative human impacts on the world's ocean. Seven data packages are available for this project: (1) supplementary data (habitat data and other files); (2) raw stressor data (2008 and 2013); (3) stressor data rescaled by one time period (2008 and 2013, scaled from 0-1); (4) stressor data rescaled by two time periods (2008 and 2013, scaled from 0-1); (5) pressure and cumulative impacts data (2013, all pressures); (6) pressure and cumulative impacts data (2008 and 2013, subset of pressures updated for both time periods); (7) change in pressures and cumulative impact (2008 to 2013). All raster files are .tif format and coordinate reference system is mollweide wgs84. Here is an overview of the calculations: Raw stressor data -> rescaled stressor data (values between 0-1) -> pressure data (stressor data after adjusting for habitat/pressure vulnerability) -> cumulative impact (sum of pressure data) -> difference between 2008 and 2013 pressure and cumulative impact data. This data package includes 2008 and 2013 raw stressor data. The 2008 data includes 18 raster files (preceeded by raw_2008_). The 2013 data includes 19 raster files (preceeded by raw_2013_). There is no sea level rise data for 2008.